Brexit Vote Analysis

This report provides some insights into the dynamics of the 2016 Brexit vote in the UK.
Import and Inspect
brexit_results <- read_csv(here::here("data","brexit_results.csv"))

glimpse(brexit_results)
## Rows: 632
## Columns: 11
## $ Seat <chr> "Aldershot", "Aldridge-Brownhills", "Altrincham and Sale W…
## $ con_2015 <dbl> 50.592, 52.050, 52.994, 43.979, 60.788, 22.418, 52.454, 22…
## $ lab_2015 <dbl> 18.333, 22.369, 26.686, 34.781, 11.197, 41.022, 18.441, 49…
## $ ld_2015 <dbl> 8.824, 3.367, 8.383, 2.975, 7.192, 14.828, 5.984, 2.423, 1…
## $ ukip_2015 <dbl> 17.867, 19.624, 8.011, 15.887, 14.438, 21.409, 18.821, 21.…
## $ leave_share <dbl> 57.89777, 67.79635, 38.58780, 65.29912, 49.70111, 70.47289…
## $ born_in_uk <dbl> 83.10464, 96.12207, 90.48566, 97.30437, 93.33793, 96.96214…
## $ male <dbl> 49.89896, 48.92951, 48.90621, 49.21657, 48.00189, 49.17185…
## $ unemployed <dbl> 3.637000, 4.553607, 3.039963, 4.261173, 2.468100, 4.742731…
## $ degree <dbl> 13.870661, 9.974114, 28.600135, 9.336294, 18.775591, 6.085…
## $ age_18to24 <dbl> 9.406093, 7.325850, 6.437453, 7.747801, 5.734730, 8.209863…Our main outcome variable (or y) is leave_share, which is the percent of votes cast in favour of Brexit, or leaving the EU. Each row is a UK parliament constituency.
Explore
A histogram, a density plot, and the empirical cumulative distribution function of the leave % in all constituencies was plotted to get a sense of the spread, or distribution of the data.
# histogram
ggplot(brexit_results, aes(x = leave_share)) +
  geom_histogram(binwidth = 2.5) +
  labs(title = "Histogram of Constituency Leave Votes",
       subtitle = "Vote spread uneven across constituencies",
       x = "Leave votes in constituency (%)",
       y = "Number of constituencies") +
  theme_bw()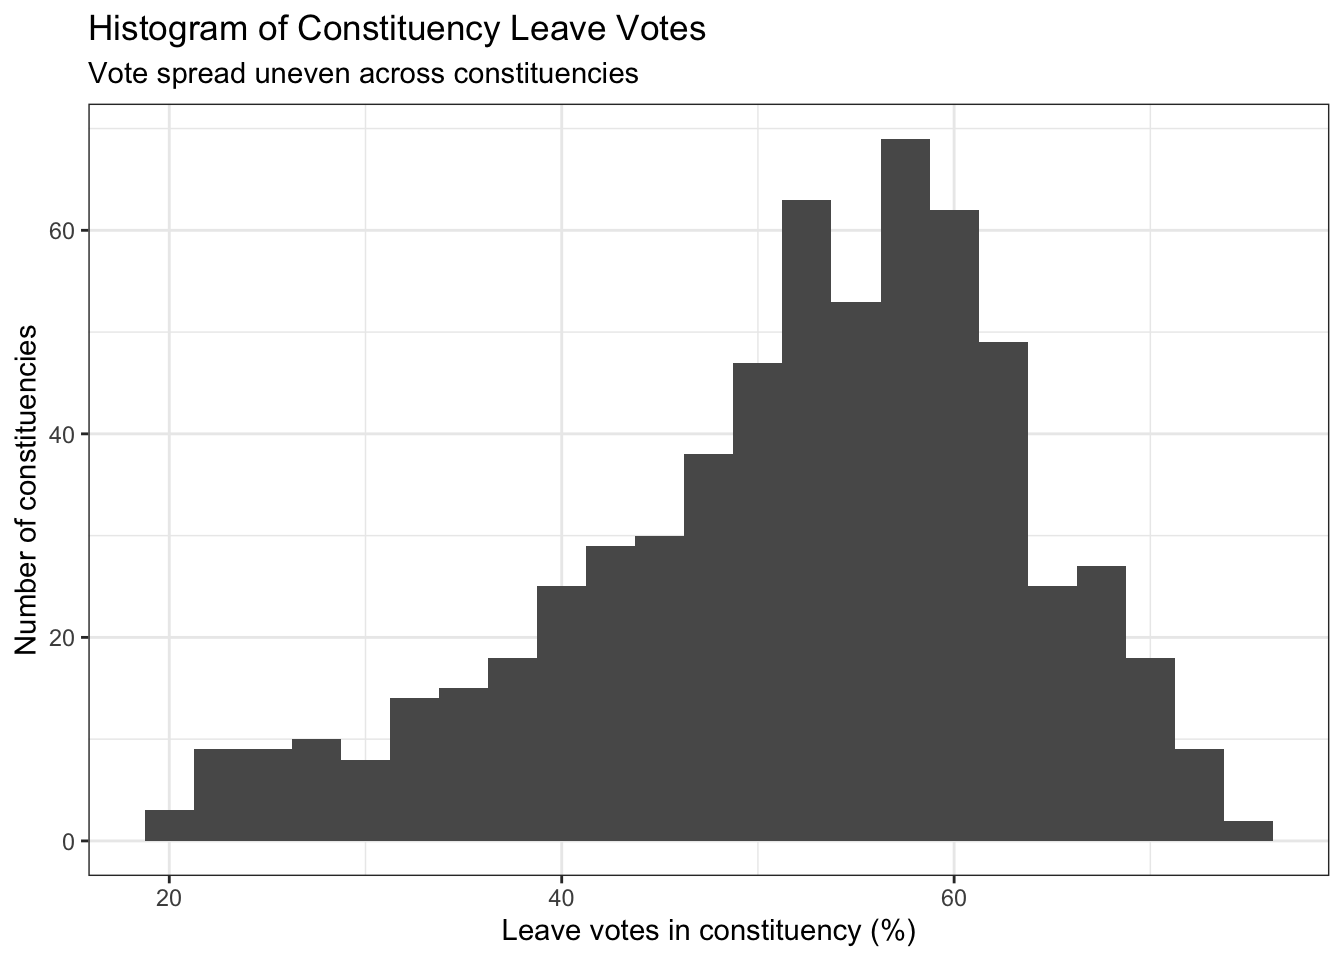
# density plot
ggplot(brexit_results, aes(x = leave_share)) +
  geom_density() +
  labs(title = "Density Plot of Constituency Leave Votes",
       subtitle = "The peak is just over 55%",
       x = "Leave votes in constituency (%)",
       y = "Density") +
  theme_bw()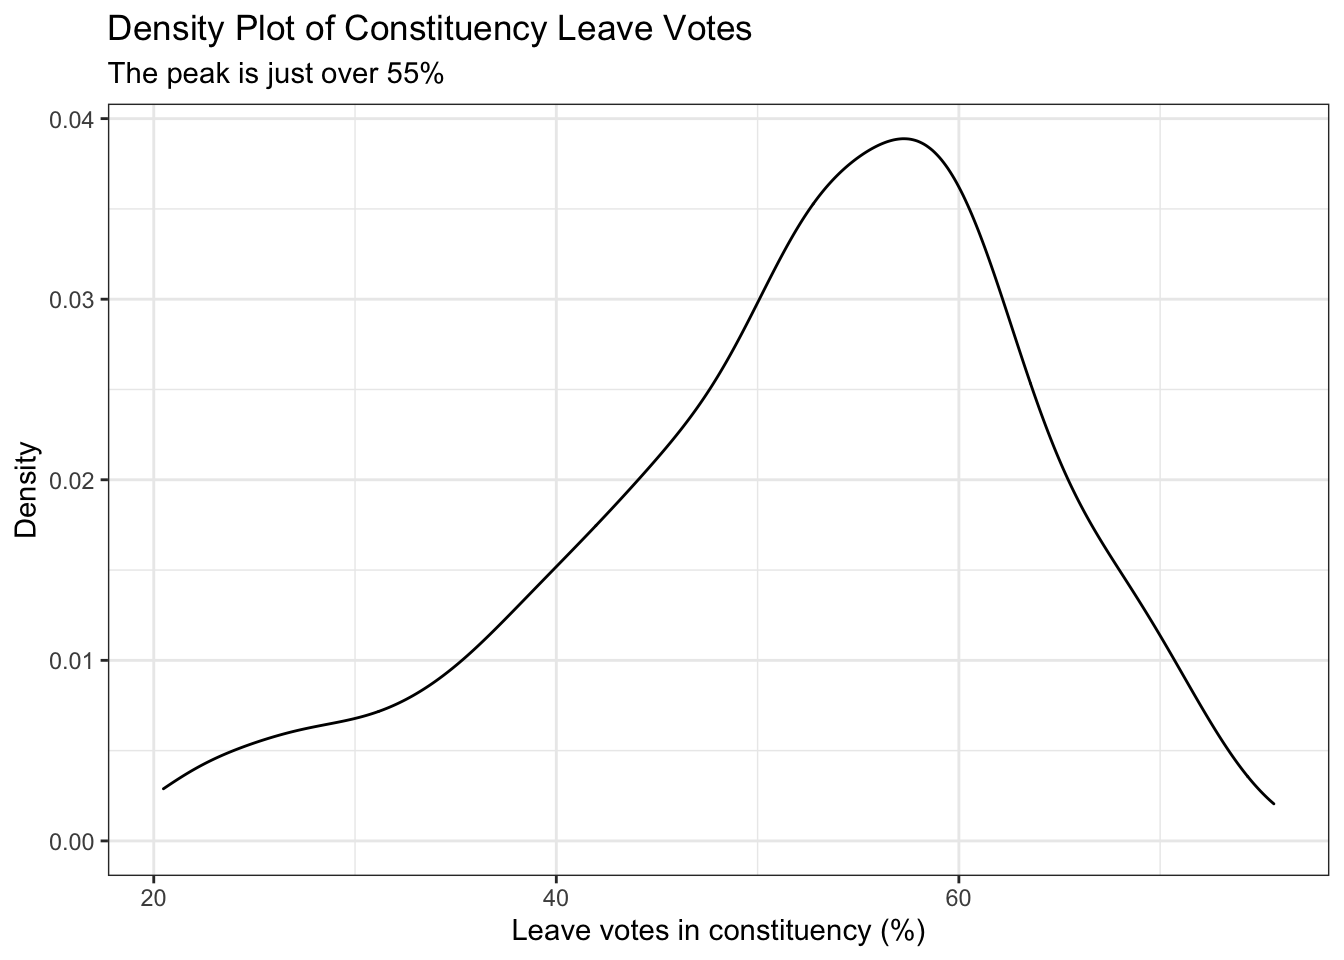
# The empirical cumulative distribution function (ECDF)
ggplot(brexit_results, aes(x = leave_share)) +
  stat_ecdf(geom = "step", pad = FALSE) +
  scale_y_continuous(labels = scales::percent) +
  labs(title = "ECDF Plot of Constituency Leave Votes",
       subtitle = "About 37% of constituencies had less than 50% leave votes",
       x = "Leave votes in constituency (%)",
       y = "% of constituencies") +
  theme_bw()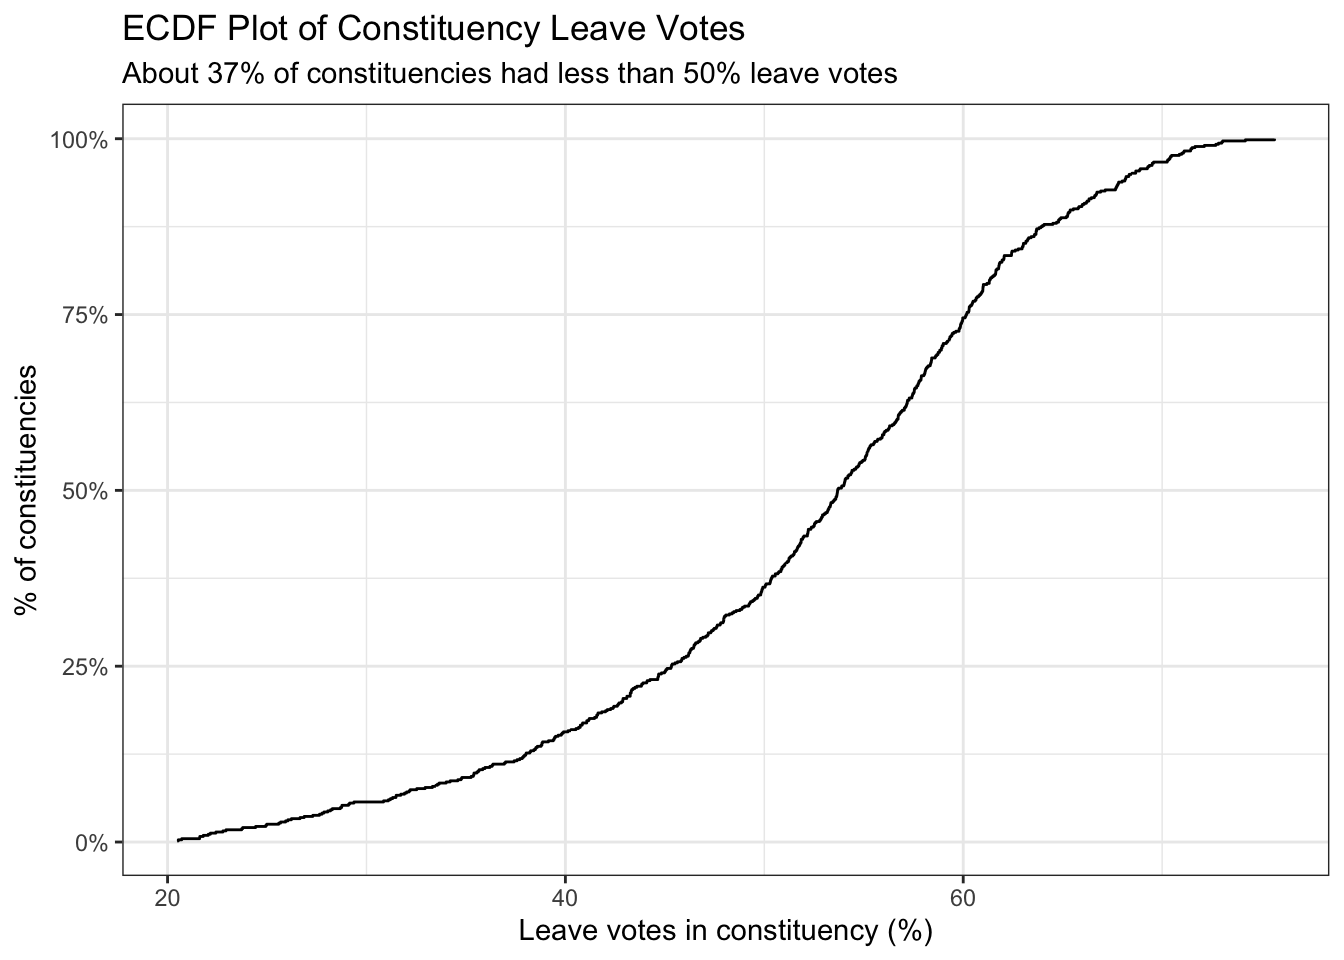
One common explanation for the Brexit outcome was fear of immigration and opposition to the EU’s more open border policy. We can check the relationship (or correlation) between the proportion of native born residents (born_in_uk) in a constituency and its leave_share by getting the correlation between the two variables.
brexit_results %>%
  select(leave_share, born_in_uk) %>%
  cor()
## leave_share born_in_uk
## leave_share 1.0000000 0.4934295
## born_in_uk 0.4934295 1.0000000The correlation is almost 0.5, which shows that the two variables are positively correlated. A scatter plot was also created between these two variables using geom_point.
ggplot(brexit_results, aes(x = born_in_uk, y = leave_share)) +
  geom_point(alpha=0.3) +
  geom_smooth(method = "lm") +
  theme_bw() +
  labs(title = "Brexit leave votes vs native born residents",
       subtitle = "Leave votes higher in areas with low immigration",
       x = "% of UK-born residents",
       y = "% of leave votes") +

  NULL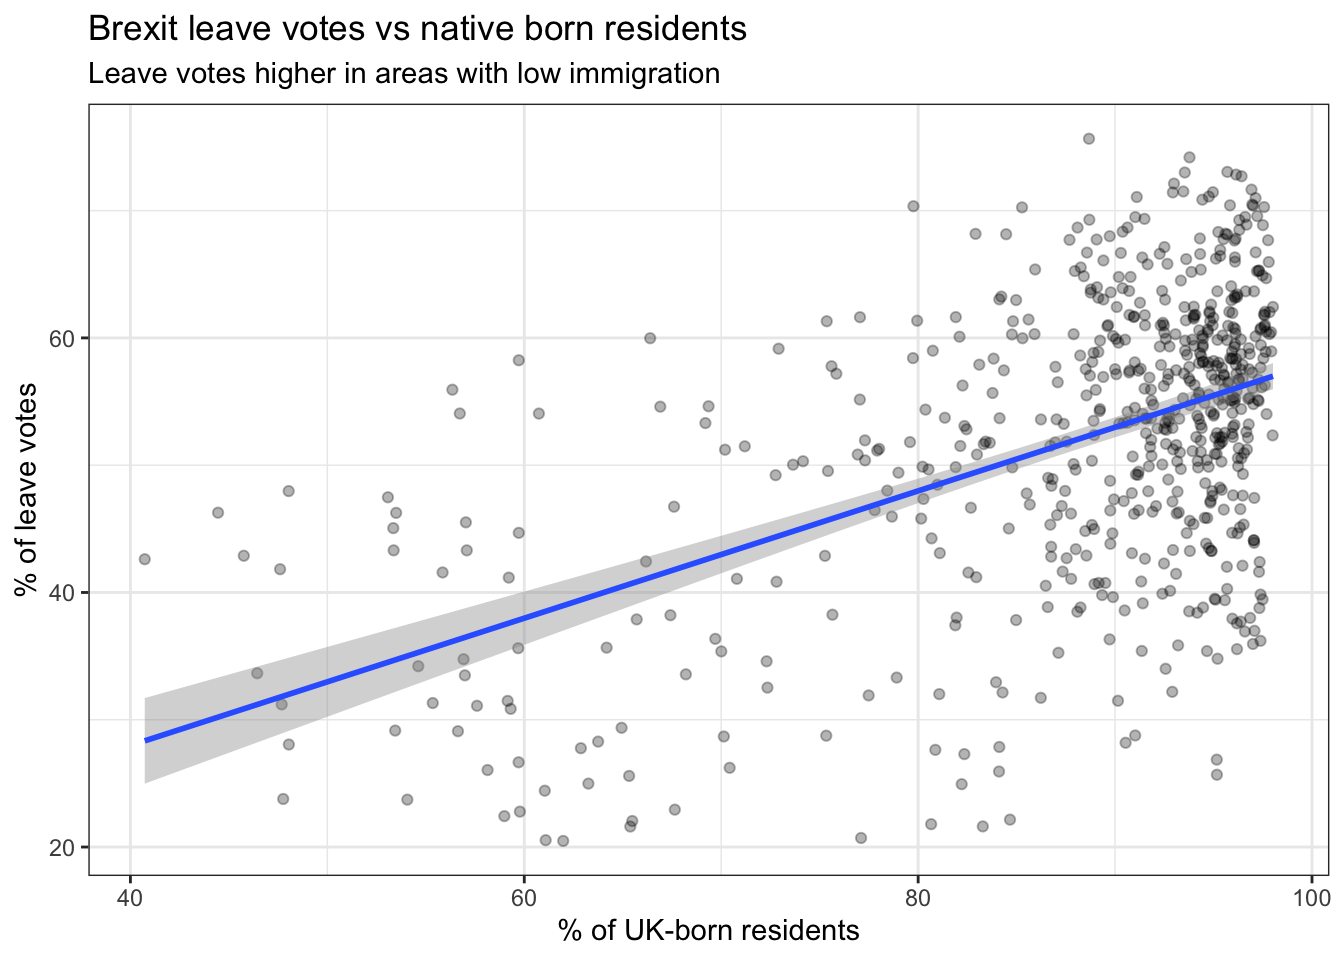
Analysis
There is a positive relationship between the proportion of native born residents in a constituency and its percentage of votes cast leaving the EU. The higher the proportion of native born residents in a constituency, the higher its percentage of votes cast leaving the EU.
This is in line with what has been mentioned above - one common explanation for the Brexit outcome was fear of immigration and opposition to the EU’s more open border policy. Areas with high UK-born populations are usually in the suburbs, which as opposed to urban areas, houses more economically disadvantaged and low skilled communities. I believe these groups were the most likely to support Brexit as they are naturally worried about competition for jobs due to immigration.
I believe people in urban areas fear competition for jobs as well, but I think what causes this divide in attitude towards immigration is their education levels. For instance, people who has a higher education level might believe that a more open border policy will further expand the economy and create much more job opportunities instead.